Twelve Fancy Chrome DevTools Tips
Breakpoints in JavaScript. Inspecting HTML and CSS and updating them live. Profiling performance… That’s right, this week’s post is all about the developer tools in IE8.
[What’s that? Really? Are you sure? I see, thank you. Goodbye. No no, that won’t be necessary.]
Folks I’ve just been informed that no one else is fond of IE8 quite like I am, so this week’s post will instead be about Chrome’s DevTools. Specifically, I use Chrome Canary and so should you. Not just because it’s a reference to the cute little birds that willingly sacrificed their lives so that we could have fresh coal.
So here is a list of DevTools tips that I hope you didn’t know at least one of. And if that one you didn’t know is actually useful, well quite frankly I’ll be over the moon.
(I have animated gifs in this post which are useful for the first loop then intensely annoying thereafter. If you’re on a big computer I suggest opening the dev tools and deleting the DOM node that holds the image. If you’re on a small computer simply cover the offending part of the screen with a playing card or scarf.)
Let the games … … begin.
Edit: this edit is good enough to go right at the top of the list. A comment from some smarty pants in the comments has learned me that
copy (someVariable)will put the value of that variable on the clipboard. I’m going to use the hell out of that.
Now on with the show…
1. Animation inspection
Animations are lovely. They delight the user and, more importantly, they delight me. The animation stuff in DevTools lets you slow down all animations on the page to 25% or 10% (thus seeing the world like a rabbit does), or even scrub across a particular animation.

2. Pretty Screenshotting
When you’re in device mode, you can turn on device frame and when you click capture screenshot it will capture a screenshot including the device frame.

The result is, you probably guessed, like this:

3. $0 in console
This is a pretty stingy tip.
Typing $0 in the console gives you a reference to the currently selected DOM node in the Elements panel.
This is a proper reference to the element, so for example you can do $0.classList.add(‘touch-of’) or $0.getBoundingClientRect() to size it up or, if you have jQuery on the page, you could do something like $($0).data() to see the data on it.
By default, Chrome will show you a DOM-style representation of the object. If you want to see the element as a JavaScript object, you can type console.dir($0).
Behold, the difference:

If you are cool enough to be using React and have the React dev tools extension installed, then $r is a reference to the react component. So for example you can see the props by typing $r.props.

Bonus tip: you can type the ID of an element in the console and get a reference to that element, since element IDs are kinda-sorta-but-not-really global variables. Weird.
4. Arrow functions in the console
This isn’t really a DevTools tip, but I’m in charge so you’ll read this and you’ll like it. With the advent of arrow functions, it’s now more viable to write useful one-liners in the console. E.g. performance.getEntries().filter(entry => entry.name.includes(‘static’)) spits out some somewhat interesting info about all of my requests from a domain with static in the name.
Of course if you must have more than one line, you can press shift+enter to wrap to a new line without executing the code. The console is powered by CodeMirror (since Chrome 56) and has a thing called ‘smart return’. So if it thinks you want to write a new line of code, pressing enter will give you a new line. It doesn’t seem to work inside callbacks though.
Thanks to Kayce for pointing this out.
5. Selector selecting
The search box on the Elements panel doesn’t just search for strings (this is exciting, what else does it do?!), it will match CSS selectors too. This can be particularly handy for non-web-developers needing to write selectors, e.g. for automation testing.
Here I am having fun searching for matches to .section-inner p:nth-of-type(2)

6. Experimenting with colors
When you’re experimenting with colors, you can use the eyedropper to select any element on the page, or select from a palette of colors that are already on the page. Or just select from the material design colors.

7. Checking the rendered font
Sometimes it’s not easy to tell which font is actually being rendered. At the bottom of the Computed tab on the Elements tab, you can see which font was used, even if it’s name isn’t in the font-family list.

That is not a useful tip, but ‘eleven’ has too many syllables.
8. Edit any text on the page
So, you have a fixed width menu and you want to know if longer text will wrap with any level of grace. Drop that doc into design mode!
You can then click and type anywhere you have text.

If you’re the person that decided it should be on/off, instead of true/false, I would like to have a word with you in my office please.
9. Filmstrip
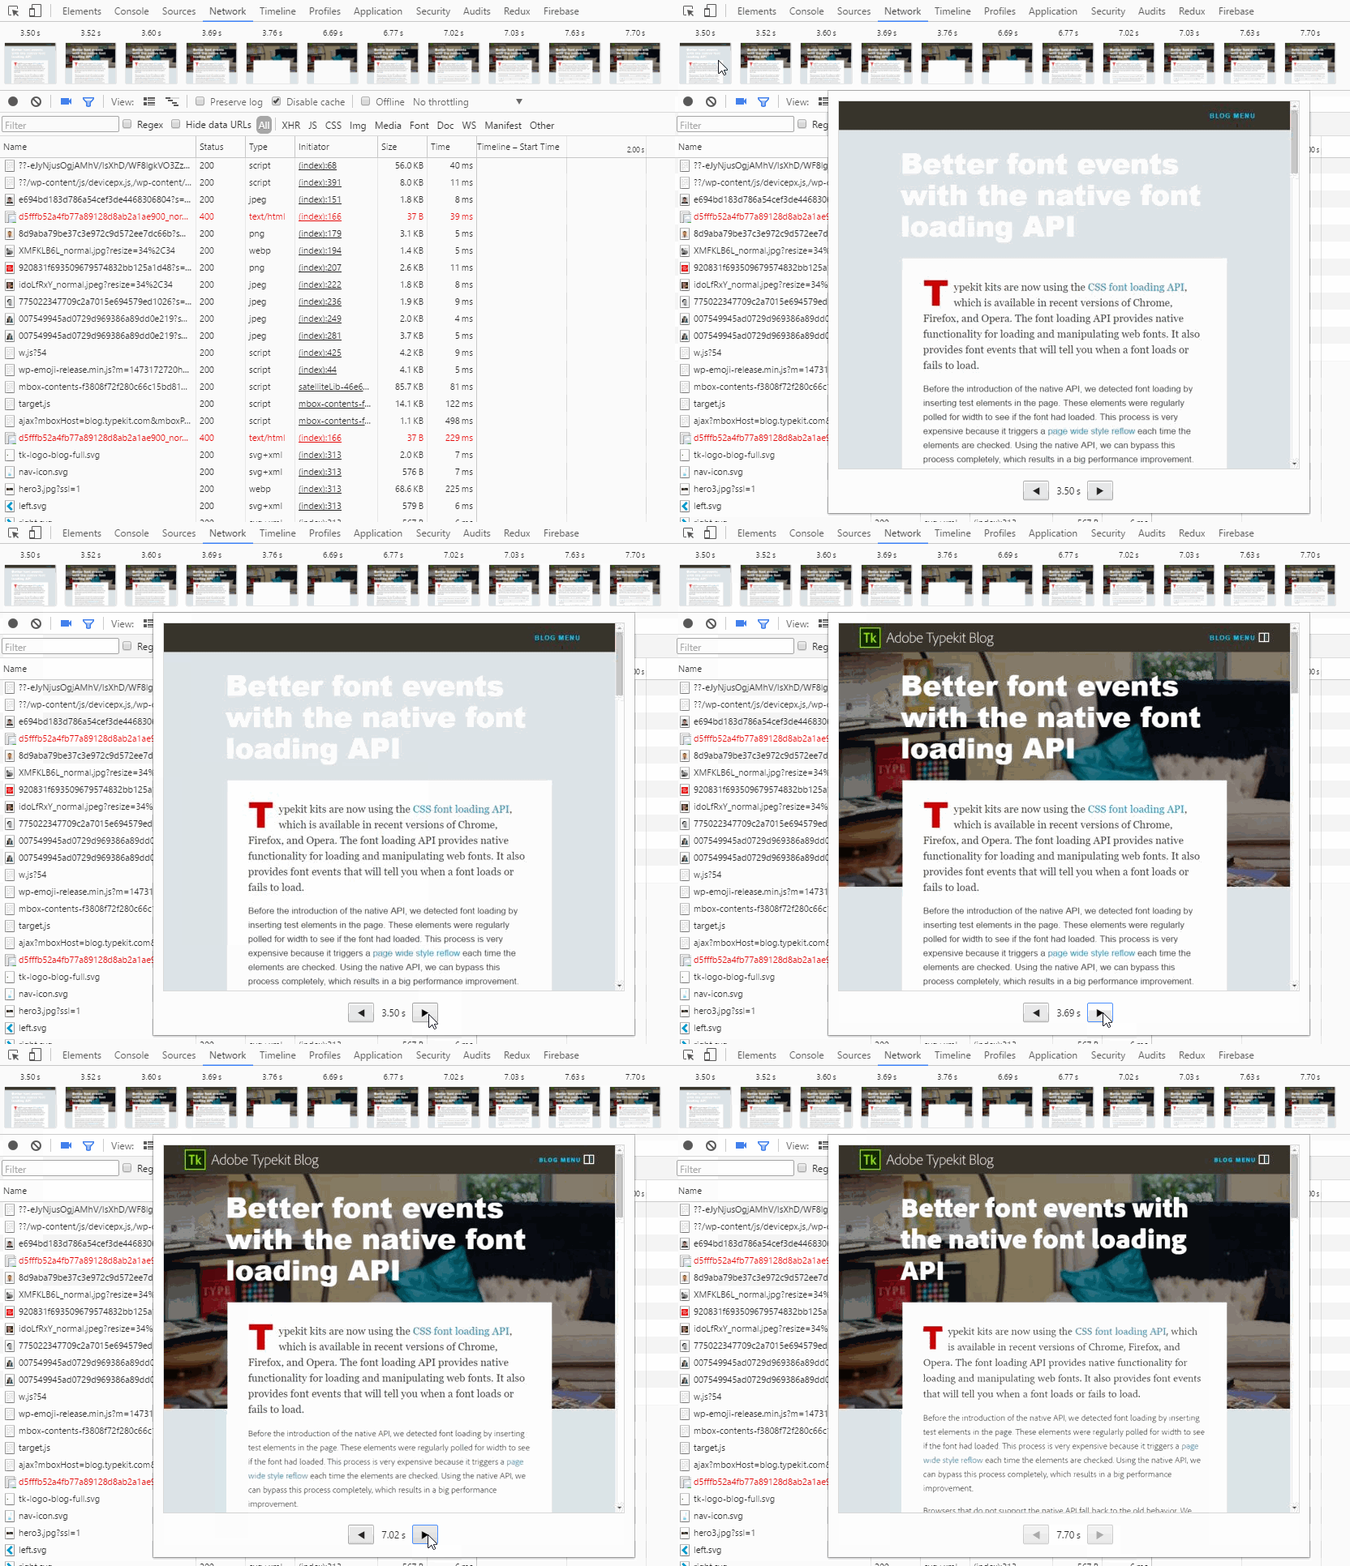
The single greatest feature for performance tuning is the filmstrip mode on the Network tab. It keeps you focused on what the user experiences rather than obscure metrics like domContentLoaded.
It’s also great if you simply want to bathe in the irony of Adobe’s page about font loading.

I watch this whenever I’m sad. My favourite part is when all the text disappears.
10. Filtering on the network tab
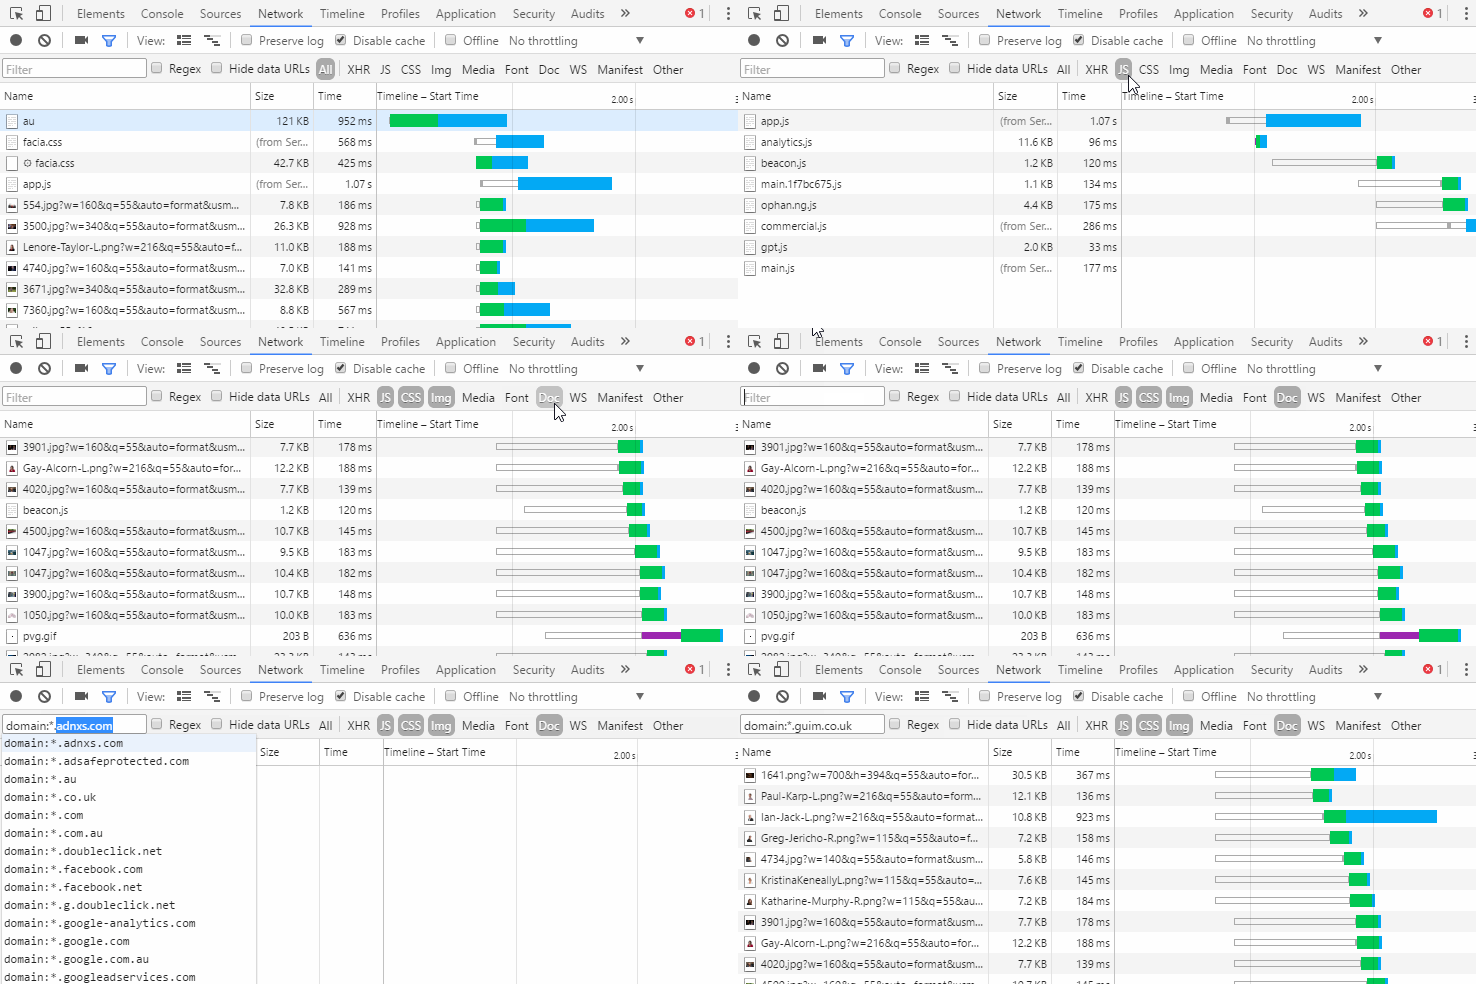
If you’re doing any performance work you want to know what’s coming across the wire. If your site has ads, that’s probably 200 things. To shorten the list, you can filter by asset type (hold cmd/ctrl to select multiple) and by domain too.

11. Dark theme
Because dark theme.

12. Chrome snippets
I love snippets. (It’s a real pity they’re not synced between browsers with my other Chrome settings).

What’s cool is that they execute in the context of the page. So the snippet code will behave the same as your application code with regards to DOM access, relative URLs, cookies, and CORSs stuff.
End
You’re probably wondering what you should do next with your life. I have a suggestion. Calculate how much time you spent in dev tools over the course of the last year. Now put aside 0.5% of that time for reading the docs over the next week.
If you would like to share your favourite tips in the comments please do. If they’re really awesome I’ll probably feel threatened and delete them so keep ‘em mediocre.
Oh I just thought of a bonus tip. When you install Chrome Canary, sign in and sync it with your Google account, but go into Advanced sync settings and deselect ‘extensions’. That way you’ve got your history and bookmarks and all that handy stuff synced, but you don’t have all your DOM-manipulating extensions messing with your development environment.

Hacker Noon is how hackers start their afternoons. We’re a part of the @AMI family. We are now accepting submissions and happy to discuss advertising & sponsorship opportunities.
If you enjoyed this story, we recommend reading our latest tech stories and trending tech stories. Until next time, don’t take the realities of the world for granted!


